Using the Tools
Land Management Analysis: A Guide
Land Management Analysis: A Guide
Land Management Analysis (LMA) is Downforce's advanced soil health analytics platform that helps you understand how your farming decisions impact soil organic carbon (SOC) sequestration. By combining your cropping data with Downforce's proprietary soil carbon measurements, LMA reveals which crops, rotations, fields, an
Land Management Analysis (LMA) is Downforce's advanced soil health analytics platform that helps you understand how your farming decisions impact soil organic carbon (SOC) sequestration. By combining your cropping data with Downforce's proprietary soil carbon measurements, LMA reveals which crops, rotations, fields, an
Overview
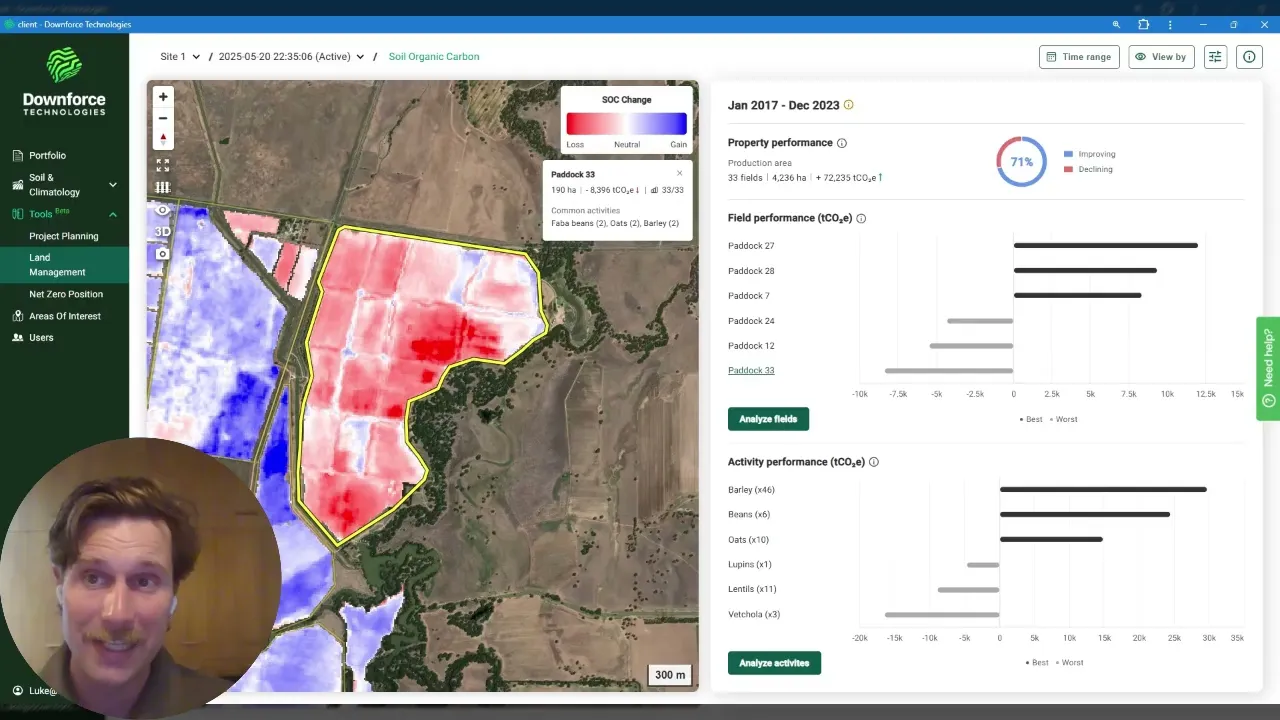
Land Management Analysis (LMA) is Downforce’s soil health analytics product. It helps you understand how your farming decisions affect soil organic carbon (SOC), by combining your cropping data with Downforce’s soil carbon measurements to reveal which crops, rotations, fields and management blocks are driving change in your soil - for better or worse.
What LMA does for you
LMA analyses the relationship between your land management practices and SOC change over time, across several levels:
Crop performance — compare how different crops affect SOC sequestration
Rotation analysis — evaluate multi-crop rotation strategies and their long-term soil health effects
Field assessment — identify your highest and lowest performing fields
Block evaluation — analyse groups of fields managed together as blocks
Getting started
Prerequisites
Before using LMA, you need:
Field boundaries — so we know where to analyse.
Required: upload field boundary data through the Area of Interest page
Optional: define management blocks (grouped fields) via the Area of Interest page
Activity data — information about one primary activity on each field, from 2017 onwards. More years give better insights.
LMA currently supports one activity type per analysis. Focus on your most important one - usually crops planted, but it could be livestock grazing periods or a major regenerative practice you want to analyse (for example, a switch from conventional tillage to no-till).
What we need for each activity:
What — activity type (e.g. wheat crop, corn crop, livestock rotation)
Where — field name (must match your uploaded field boundaries)
When — time period, including sow and harvest dates (as season or year, ideally with the month)
Format — upload as CSV or spreadsheet via the LMA page
Contact support@downforce.tech for help with data entry.
Core features
Summary view
An at-a-glance assessment of your property’s SOC performance:
Interactive property map with colour-coded SOC change
Performance scorecards showing top vs. bottom performers
Quick filtering by time range, level and measurement unit
Analysis views
For deeper investigation, four perspectives:
Field view — individual field performance and management practices
Block view — management block performance (grouped fields)
Crop view — crop species performance across all fields
Rotation view — multi-crop rotation effectiveness (available August 2025)
Crop cycle analysis
LMA analyses cropping data using standardised cycle lengths:
3-month cycles — seasonal crops
6-month cycles — semi-annual crops
12-month cycles — annual crops
Note: by default, LMA uses the shortest cycle detected across your farm. For example, if most fields have 12-month crops but one has 3-month crops, all analysis uses 3-month cycles. To set a specific cycle length (3, 6 or 12 months), let the Downforce team know. Future versions will let you switch between cycle lengths yourself.
Customising crop cycles: to view shorter crops as part of longer cycles (e.g. 3-month crops within 12-month cycles), group them in your spreadsheet before upload - for example, combine four 3-month crops as one 12-month entry. Contact Downforce for help organising your data.
Crop rotation analysis
Rotation-level analysis lets you specify:
Number of crops per rotation (2, 3, 4 or 5)
Rotation start date (must allow at least one complete rotation)
LMA calculates rotation performance by measuring SOC change from rotation start to end, then averaging across every instance of that rotation on your farm.
Example: a 3-crop rotation with 12-month cycles, occurring 10 times across your farm, gives a 3-year rotation analysis showing either cumulative impact (t, tCO₂e) or average impact (%, t/ha) across those 10 instances.
Time range flexibility
Focus your analysis on specific periods:
Full dataset — typically 2017–2024, based on your SOC and crop data
Custom ranges — specific years or periods
Understanding your results
Performance rankings
LMA shows top 3 vs. bottom 3 performers across all analysis types:
SOC change shown as %, t, t/ha or tCO₂e (via the metrics option, top right)
Visual comparisons through charts and colour-coded maps
Relative performance against overall property performance
SOC change calculations
Individual level — average SOC change across the field, from start to end of the selected time range
Aggregated levels — area-weighted averages for blocks, crops and rotations
Advanced features
Management blocks
Create and analyse custom groupings of fields:
Upload block definitions via the Area of Interest page
Analyse groups of fields managed with similar practices
Compare block performance against other blocks
Tabular analysis
Click Analyse to view full data tables showing all crops, rotations, fields or blocks with their SOC performance metrics.
Potential future releases
Based on user feedback, future enhancements may include:
Individual practice analysis — assessment of specific practices (e.g. tillage, input usage)
Customisable crop cycles — different cycle lengths per crop type (e.g. tomatoes 90 days, lettuce 45 days, corn 120 days)
Export — download farm data in multiple formats (CSV, Excel, PDF) for reporting or sharing
Your feedback shapes our development priorities.
Getting support
Contact support@downforce.tech for help with:
Data upload and organisation
Product navigation
Interpreting results
Feature requests and feedback
Want to see how LMA can help your business? Get in touch.
Overview
Land Management Analysis (LMA) is Downforce’s soil health analytics product. It helps you understand how your farming decisions affect soil organic carbon (SOC), by combining your cropping data with Downforce’s soil carbon measurements to reveal which crops, rotations, fields and management blocks are driving change in your soil - for better or worse.
What LMA does for you
LMA analyses the relationship between your land management practices and SOC change over time, across several levels:
Crop performance — compare how different crops affect SOC sequestration
Rotation analysis — evaluate multi-crop rotation strategies and their long-term soil health effects
Field assessment — identify your highest and lowest performing fields
Block evaluation — analyse groups of fields managed together as blocks
Getting started
Prerequisites
Before using LMA, you need:
Field boundaries — so we know where to analyse.
Required: upload field boundary data through the Area of Interest page
Optional: define management blocks (grouped fields) via the Area of Interest page
Activity data — information about one primary activity on each field, from 2017 onwards. More years give better insights.
LMA currently supports one activity type per analysis. Focus on your most important one - usually crops planted, but it could be livestock grazing periods or a major regenerative practice you want to analyse (for example, a switch from conventional tillage to no-till).
What we need for each activity:
What — activity type (e.g. wheat crop, corn crop, livestock rotation)
Where — field name (must match your uploaded field boundaries)
When — time period, including sow and harvest dates (as season or year, ideally with the month)
Format — upload as CSV or spreadsheet via the LMA page
Contact support@downforce.tech for help with data entry.
Core features
Summary view
An at-a-glance assessment of your property’s SOC performance:
Interactive property map with colour-coded SOC change
Performance scorecards showing top vs. bottom performers
Quick filtering by time range, level and measurement unit
Analysis views
For deeper investigation, four perspectives:
Field view — individual field performance and management practices
Block view — management block performance (grouped fields)
Crop view — crop species performance across all fields
Rotation view — multi-crop rotation effectiveness (available August 2025)
Crop cycle analysis
LMA analyses cropping data using standardised cycle lengths:
3-month cycles — seasonal crops
6-month cycles — semi-annual crops
12-month cycles — annual crops
Note: by default, LMA uses the shortest cycle detected across your farm. For example, if most fields have 12-month crops but one has 3-month crops, all analysis uses 3-month cycles. To set a specific cycle length (3, 6 or 12 months), let the Downforce team know. Future versions will let you switch between cycle lengths yourself.
Customising crop cycles: to view shorter crops as part of longer cycles (e.g. 3-month crops within 12-month cycles), group them in your spreadsheet before upload - for example, combine four 3-month crops as one 12-month entry. Contact Downforce for help organising your data.
Crop rotation analysis
Rotation-level analysis lets you specify:
Number of crops per rotation (2, 3, 4 or 5)
Rotation start date (must allow at least one complete rotation)
LMA calculates rotation performance by measuring SOC change from rotation start to end, then averaging across every instance of that rotation on your farm.
Example: a 3-crop rotation with 12-month cycles, occurring 10 times across your farm, gives a 3-year rotation analysis showing either cumulative impact (t, tCO₂e) or average impact (%, t/ha) across those 10 instances.
Time range flexibility
Focus your analysis on specific periods:
Full dataset — typically 2017–2024, based on your SOC and crop data
Custom ranges — specific years or periods
Understanding your results
Performance rankings
LMA shows top 3 vs. bottom 3 performers across all analysis types:
SOC change shown as %, t, t/ha or tCO₂e (via the metrics option, top right)
Visual comparisons through charts and colour-coded maps
Relative performance against overall property performance
SOC change calculations
Individual level — average SOC change across the field, from start to end of the selected time range
Aggregated levels — area-weighted averages for blocks, crops and rotations
Advanced features
Management blocks
Create and analyse custom groupings of fields:
Upload block definitions via the Area of Interest page
Analyse groups of fields managed with similar practices
Compare block performance against other blocks
Tabular analysis
Click Analyse to view full data tables showing all crops, rotations, fields or blocks with their SOC performance metrics.
Potential future releases
Based on user feedback, future enhancements may include:
Individual practice analysis — assessment of specific practices (e.g. tillage, input usage)
Customisable crop cycles — different cycle lengths per crop type (e.g. tomatoes 90 days, lettuce 45 days, corn 120 days)
Export — download farm data in multiple formats (CSV, Excel, PDF) for reporting or sharing
Your feedback shapes our development priorities.
Getting support
Contact support@downforce.tech for help with:
Data upload and organisation
Product navigation
Interpreting results
Feature requests and feedback
Want to see how LMA can help your business? Get in touch.